DataRobot — An end to end AI platform
Introduction
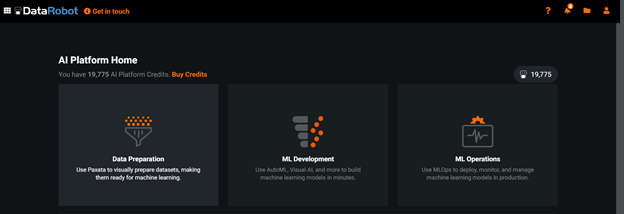
DataRobot is an online platform that provides end to end Artificial Intelligence services. These services include
1. Data preparation
Cleaning and transforming raw data into data that is ready to be sent as input to a Machine learning model.
2. Machine learning development
Building machine learning models using the data that is provided.
3. Machine learning operations
Deploying and monitoring the machine learning models in production.
In this blog post, we will be exploring DataRobot and sharing our insights into this tool. The rest of the blog post is organised as follows.
- What problems does DataRobot address?
2. Use Case: Movie Streaming Scenario
3. Strengths and Limitations
- What problems does DataRobot address?
Each of the three services that DataRobot provides address multiple problems respectively.
Data Preparation
The data preparation service addresses problems related to data quality. One of the most pertinent problems in data quality is the presence of invalid values and outliers. By analysing the data visually, we can find trends that can guide us to identify these issues and clean the data therein. In addition, data often needs to be augmented before sending it as an input to an ML system. This is typically achieved by adding user-defined features that can be derived from the raw data. Finally, when so many changes are being made to the raw data, the different versions of the data need to be maintained and monitored. The effective audit trail (log of changes made) and version control system (log of retrievable versions of the data) can help keep track of the changes made. The following sections describe in detail how data analysis, data cleaning, data augmentation, and version control can be implemented in DataRobot to mitigate the aforementioned issues.
1. Data Analysis
a. Visual representations
Any column of the data set that is uploaded to DataRobot can be analysed visually by simply clicking on the filter icon next to the column name. This helps analyse the distribution of values in a particular column.
In the following example, we can see the number of customers from each city and the distribution of ages for all the customers.

We can also use this tool to showcase data relations. For example, in the image below, we can see the number of customers who are within the ages 22–22.25 that reside in each city.

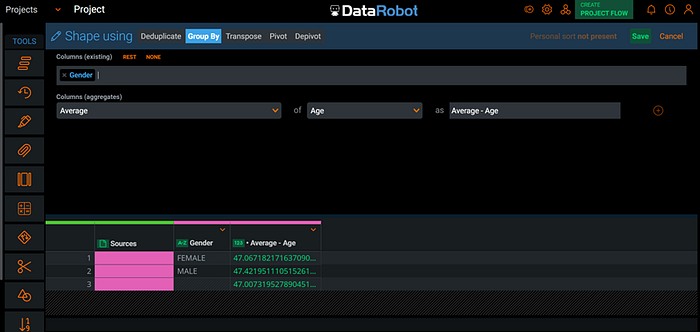
b. Aggregate fields
We can also use DataRobot to analyse the data using aggregate fields like averages, counts, max, min etc. In the following example, we can retrieve the average age of customers in a particular gender.
2. Data Cleaning
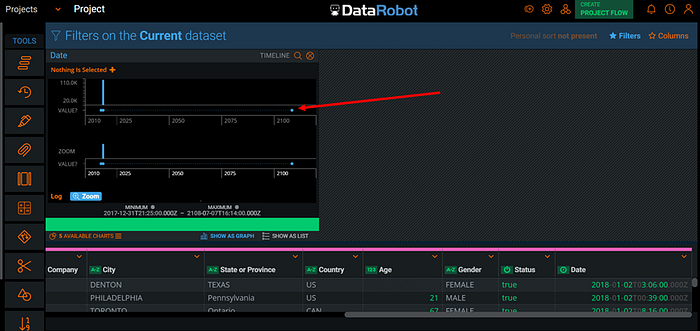
a. Remove invalid values
DataRobot can identify and remove invalid values efficiently. Take for example the date field in the data. Upon analysis, we find that although most dates are between 2018 and 2019, there is one data point that is for the year 2108. Since this year is invalid (as it is in the future and so cannot be part of the log of when the customer entered his/her data), we can remove this entry from our data.
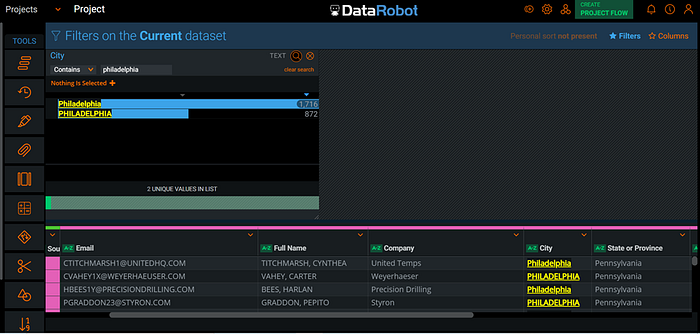
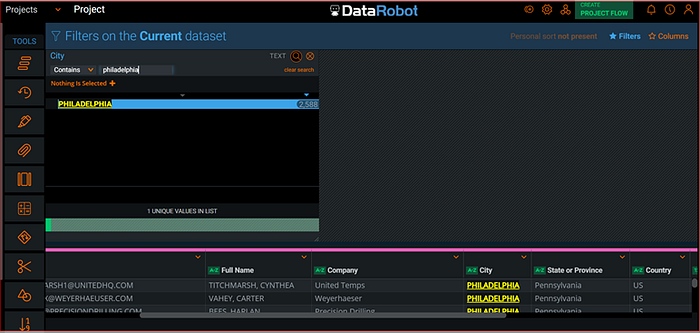
b. Remove duplicates
Duplicates are often an issue with data, that is often caused due to mismatched case, trailing white spaces spelling mistakes etc. In this example, we have two entries for the city of Philadelphia. DataRobot allows us to easily identify the duplicates and remove the inconsistency quickly and efficiently.

3. Data Augmentation
a. Join datasets
Multiple datasets can also be joined on DataRobot by specifying an attribute upon which the two data tables can be joined. In addition, DataRobot also automates the identification of the field with which the tables should be joined by running an analysis on how much the two tables match for each field. The fields are ranked and the selection of the field with which the two tables to be joined is left up to the user.
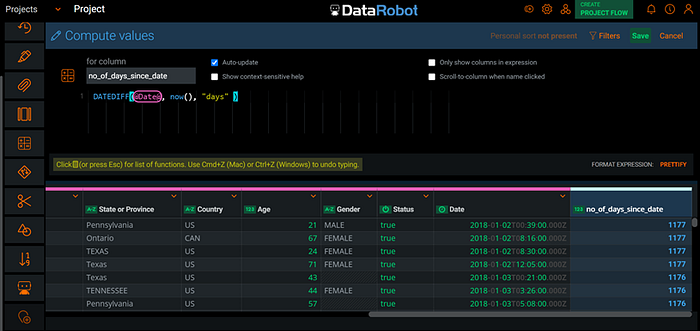
b. User defined features
DataRobot allows users to add fields to the data table, using formulae that takes in as parameters, the existing fields of the table. For example, we can calculate the number of days elapsed since the customer entered his/her details into the system.
4. Data Version control and tracking
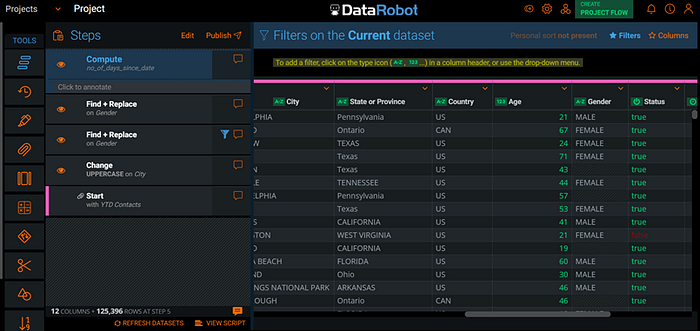
a. Audit trail
DataRobot provides an audit trail under their “steps” tab that keeps a track of all the changes that are made to the data.
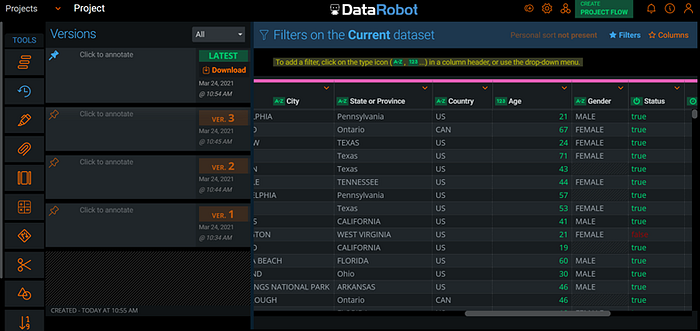
b. Version control
DataRobot provides version control under their “versions” tab to keep a log of all the versions of the data. Any version can be downloaded for use and previous versions of the data can be retrieved from here. In addition, each version can be annotated with the changes made.
ML Development
The ML development service addresses problems related to the ML models. This service provides plug-and-play ML models that are automatically selected based on the data that is provided and the task that is specified (Supervised when the correct labels are available. Unsupervised when the correct labels are not available in the training data). This allows professionals who are not necessarily experts in AI to leverage the power of the ML models in the domain of their choice. Therefore, this service improves the accessibility of AI to all professionals and eliminates the problem of requiring specialised expert knowledge to develop an AI system from scratch. Furthermore, this service allows the user to run multiple models in parallel and compare their performance over a number of metrics. The following sections explain in detail, how model deployment, feature analysis and model evaluation are implemented in DataRobot.
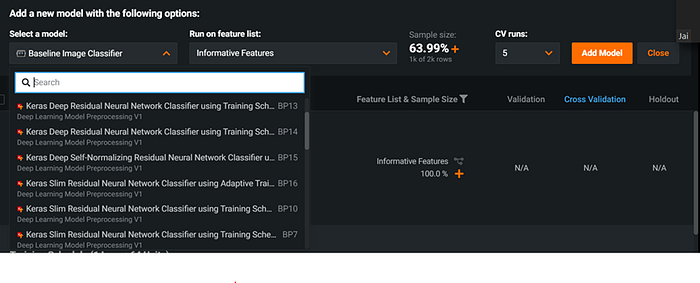
1. Training multiple models
DataRobot provides a wide range of models to choose from that are recommended based on the data provided. In this example of an image classification task, the following models are recommended by DataRobot.
1. Analysing features with data visualisation
The features that are used in the model can be analysed visually using data histograms. This can be seen in detail in the use case for the movie recommendation system.
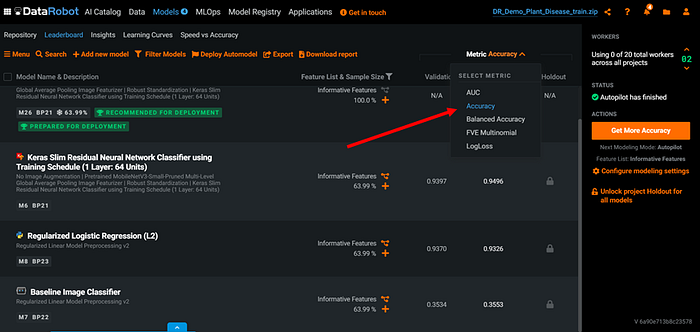
2. Understanding the model across multiple metrics
DataRobot provides multiple metrics that you can compare models against. In this example, the user can choose to compare the models against the metrics of AUC (Area under the curve graph that analyses the false positive and false negative rate), Accuracy (number of correct predictions out of all predictions made), Balanced Accuracy (the average of the number of correct predictions out of all predictions made within each class individually), FVE Multinomial (Another measure of accuracy of the model), LogLoss (Log Likelihood loss which represents how likely the prediction made by the model is). Different loss metrics will be used for different tasks.
ML Operations
The ML Operations service addresses problems related to the deployment of ML models in production. It helps keep track of the real-time performance by using a dashboard that informs the user of the predictions made and data drift. Service health is also tracked which shows the user if their service is passing, at risk of failing or failing any requests made during production. Data drift (change in model input data over time) often causes performance of the model degrade and is a major problem that this service helps monitor.
2. Use case: Movie Streaming scenario
We also explored ways that DataRobot could be applied to our class project where we are tasked with developing and operating a live movie recommendation service in production. Given the massive amounts of 24/7 streaming data, DataRobot would provide an effective way to monitor summary statistics about the data quality that could potentially drive data drift and model degradation. To test out this platform with our project, we uploaded a sample of 27,000 movie ratings into DataRobot. This dataset had already been wrangled and cleaned but those steps could have also been performed in DataRobot as described above. For instance, with easy-to-access data quality metrics, we could proactively identify the following data drift issues through the following visuals
Data Quality Visualisations for Monitoring
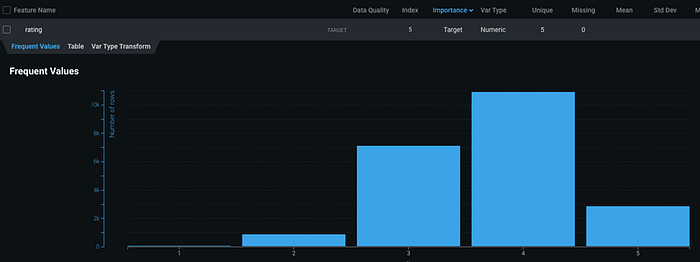
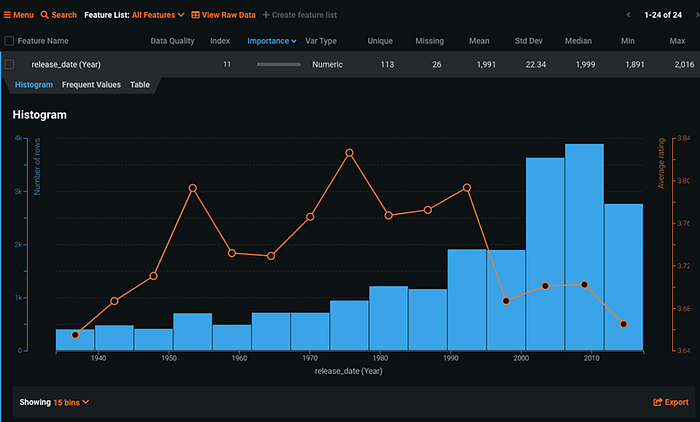
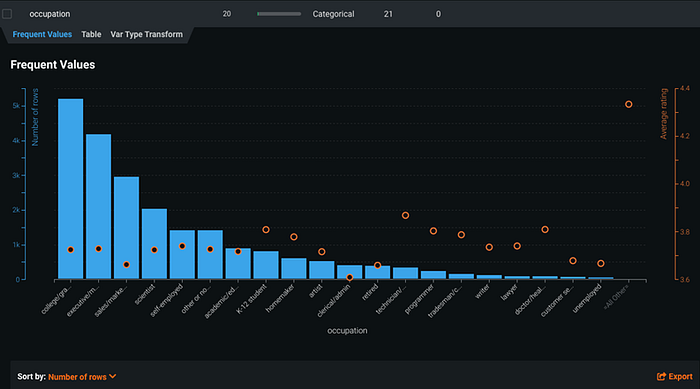
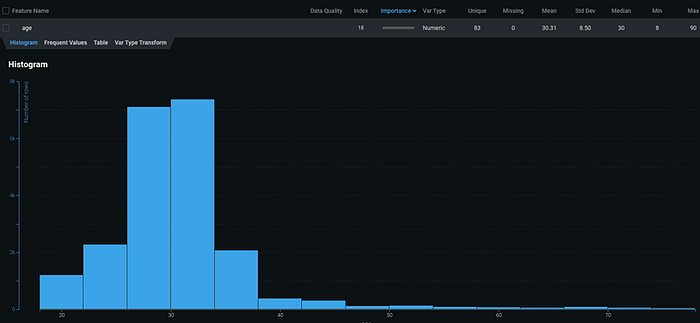
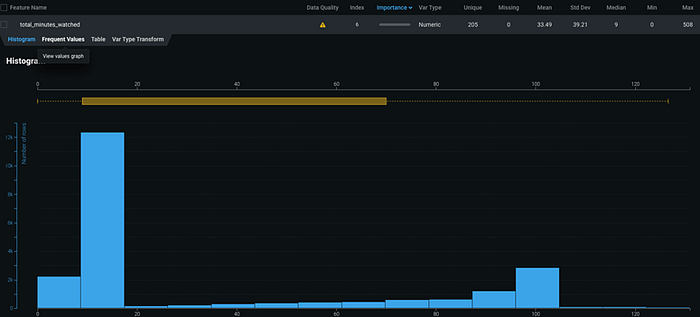
If these distributions were to change significantly as the user base grows or changes, the recommendation model would need to be updated. With these tools, DataRobot provides the ability to understand why the model is degrading and helps diagnose the key issues.
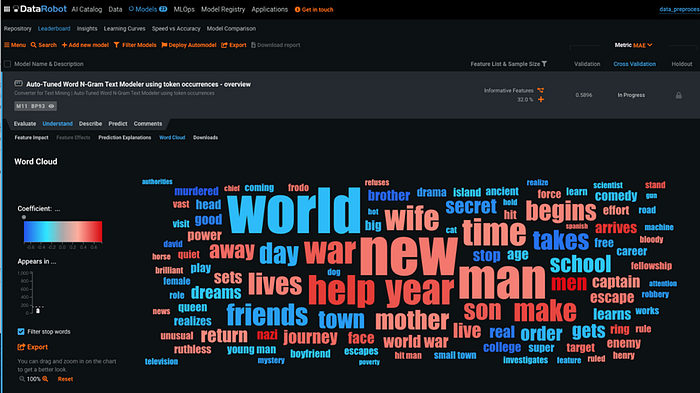
Furthermore, DataRobot’s ML Development capabilities provide a great way to explore model improvements. For instance, our movie recommendation model does not account for a movie’s IMDB description. With DataRobot, we are able to explore the potential of this quickly and efficiently before expending too many resources. For example, we used our sample user movie ratings dataset to develop a quick ML model to predict the movie rating based off of the movie IMDB description. DataRobot provides easy-to-use tools to understand the model. Once training completed, the results included Word Cloud of n-grams and the corresponding coefficients.
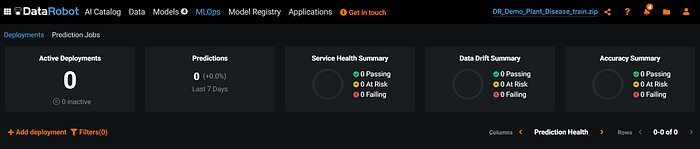
While we did not deploy our model on DataRobot, there certainly are some attractive features that could help us deliver value to users and operate efficiently. For instance, with the DataRobot deployment dashboard, we could monitor the number of predictions and trends and high level summaries of whether models are passing, at risk, or failing based on our pre-defined quality thresholds. Furthermore, by visualising model size, latency, and prediction volume, we would be able to forecast and monitor our production costs.
Strengths
1. Interactive and visual user interface
The interactive and visual interface of DataRobot is one of the most striking features of this platform. It is very user friendly and does not require the user to have extensive knowledge about AI prior to using its services. In addition, the data visualisations allow for intuitive analysis of data trends and relationships.
2. Supports communication in a team
DataRobot is great for working in a team because of the version control capabilities. Furthermore, team members can annotate their changes and keep the other members up to date with any changes or updates made to the system.
3. Supports multiple formats of data
DataRobot supports multiple formats of data including csv and xlsx. It also supports importing datasets from Amazon S3 instances.
4. Plug and play models
One of the major advantages of DataRobot is that you do not need to develop a model from scratch. DataRobot recommends a list of models based on the data you provided and the task at hand. The user can choose multiple models from this list and train the models on the data they provide so that the model is fine-tuned for the task at hand.
5. Run model simultaneously
DataRobot allows the user to run multiple models simultaneously and compare their performance. This helps the user save time because the bottle neck is the time taken to train and evaluate the slowest model instead of running the models one after the other and evaluating each of them separately.
6. Monitoring the model
The ML operations service allows the user to monitor the performance of their system in production. This includes monitoring accuracy, service health (how often does the service fail in production), and data drifts (explained above).
Limitations
1. Cost
DataRobot is not a free service and contracts with DataRobot typically last three years. The disadvantage of this is that the user needs to commit to a particular tool for three years which seems unfeasible given the competitive nature of the market and the ever-evolving field of AI.
2. Limitations for unsupervised learning
DataRobot uses their unsupervised learning mode (when there are no targets to predict) mainly to detect anomalous values. It would be more helpful to the user if there were more capabilities regarding unsupervised learning such as clustering algorithms.
References
